
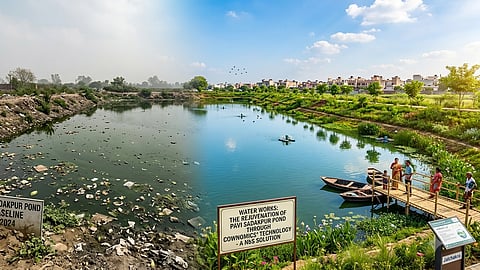
The Case Study of Rejuvenation of Pavi Sadakpur Pond through NbS solution of Cownomics Technology
Maybe following the trend over the next couple of years could give us a better picture, but at present we can’t rule out the contribution of the Waterbody, especially when we consider the larger picture of UHI impact, Air Quality impact, biodiversity trends, and various other environmental factors improving drastically. There can’t be so many coincidences. Thus, we can conclude that there’s a critical role of rejuvenated local Waterbodies, such as the Pavi Sadakpur Pond, in acting as vital flood-mitigation buffers and aquifer recharge zones during high-intensity rainfall events.The Pavi Sadakpur Pond restoration project ran from March 2024 to September 2025. It included a baseline EIA by IIT Delhi, yearlong monitoring of 18 environmental parameters, periodic water testing at an NABL-accredited lab, an SEIA study by GIDS, and a biodiversity impact assessment using GIS and drone surveys. This document analyzes the collected data.
Introduction:
The city of Ghaziabad was named after Ghazi-ud-Din – a wazir in the court of Muhammad Shah (Sultan of Delhi) around 1740 – 1750. The name "Ghaziuddinnagar" was shortened to its present form, i.e., "Ghaziabad", with the opening of the Railway station in 1864. From historical, cultural, mythological, and archaeological perspectives, Ghaziabad has been a prosperous city of strategic importance in national politics for ages. This has been proven by research and excavations conducted in the district. The excavation carried out at the mound of Kasseri, situated on the bank of the River Hindon, 2 km north of Mohan Nagar, shows that civilisation developed way back in 2500 BCE, and it has been continuously inhabited since then.
The nearby area of Loni, wherein the remains of the fort of Loni have been found, is associated with Lavanasura of the Ramayana period. According to the gazetteer, the fort was named after Lavanasura (from Lavana; it later became Loni). On the eastern border of the district is situated the village "Kot," which is associated with the famous emperor Samundragupta, who performed the Aswamedha Yagya here after destroying the fort, and with "Kot Kuljam" (princes of the Kot dynasty), an incident of great historical importance at that time.
Background:
Realising the grim situation, coupled with the scorching heat, frequent outbreaks of diseases in the vicinity, and a depleting Water table, the urban local body (ULB) wanted to implement a sustainable, long-lasting solution. This was the time when there was a central government push to implement the AMRUT 2.0 project to restore water availability in urban areas as well.
AMRUT 2.0 (Atal Mission for Rejuvenation and Urban Transformation 2.0) was launched on October 1, 2021, for a five-year period (2021-22 to 2025-26) that aimed to make Indian cities "water secure" by providing 100% functional water tap connections to all households in ~4,800 statutory towns and 100% sewerage coverage in 500 cities. With a total outlay of ₹2.99 lakh crore, focusing on rejuvenating existing water bodies in the urban areas of the country. We have about 100 Smart Cities and 500 AMRUT Cities in the country, all of which came under the aegis of this project.
Therefore, a tender vide RFP / NIT No.1255/N.P.P.LONI/E-TENDER/2023-24 Dated: 07-12-2023, was published as an open tender in which multiple bidders participated. The tender was evaluated in three stages: pre-qualification, technical, and finally commercial. The successful bidders were those who qualified in all three stages, stood T1 (technically the best suited in the first two stages) and L1 (financially the best suited in the 3rd stage, i.e., the cheapest commercially, despite being technically the best suited).
Pavi Sadakpur Pond, in the Sadakpur Village of Loni Palika Parishad, was not a pond. It would be better described as a cesspool. You can imagine the plight of the Waterbody, wherein the remaining area is merely 3.5 Acres, while untreated sewage discharge, coupled with wastewater from nearby MSME units and butcheries (carrying a lot of animal biological waste), is dumped on a daily basis.
Although many pre-intervention pictures were published in the tender document (Request for Proposal – RfP) itself, watching a photo and physical site visit was a sea-change difference. The following vital statistics of the Waterbody are a result of the same survey & study –
Map Location – 28°46'39.8"N 77°17'02.9"E
Latitude / Longitude – 28.777727, 77.284143
Surface Area – 3.45 acres
Postal Address – Om Sai City, Loni, Ghaziabad – 201102, UP
Google Map link https://goo.gl/maps/mZdFh1v7yDYTqzyy5
Jalchakra Innovations LLP (https://jalchakra.com/) is a climate tech startup in Bharat that rejuvenates waterbodies through advanced Nature-Based Solutions (NbS) to revive native ecology across Soil, Water, and Air. It is an offshoot of a real estate conglomerate from Mumbai, known for its eco-friendly, nature-friendly development of residential and commercial properties, aesthetically designed with sustainability in mind. It is known for mindful construction, rather than mindless anti-nature concrete jungles that ignore sustainability aspects like natural light, natural air, rainwater harvesting, green areas versus concrete, spacious roads, ample parking, and a balance between human needs and the planet’s necessities.
They have their technology partner, Vaidic Srijan LLP (https://vaidicsrijan.com/), which focuses on technology development in two specific domains: Climate Tech and Agri Tech. They’re working solely in the technology development domain, developing 100% Nature-based Solutions (NbS) and Ecosystem-based Approaches (EbA) for environmental restoration in situ, with no chemical / biological, or mechanical interventions. They are working in the domain of environmental restoration through their own inventions of Nature-based Solutions (NbS), such as Cownomics® Technology, as well as other Ecosystem-based Adaptations (EbA), including Ecolining®, Ecodredging®, EcoDrainR®, and our Sustainable Agriculture Solution, MAGICC®.
Waterbodies & Wetlands are often taken as merely a pool or reservoir of Water, which demeans their sheer existence as an ‘ecosystem service provider’, which was the key cause behind nature’s creation of the land-locked Waterbodies, in spite of the 73% of the planet already covered by Water. It is high time for the administration to identify them as the ‘ecosystem service provider’ as a government policy. Especially when these “ecosystem services” provided by Waterbodies and wetlands form the basic fabric of a combat plan to address the crisis caused by climate change and global warming, including Aquifer Correction and Recharge, Flood and Drought Mitigation, and avoiding waterlogging in the vicinity.
Maintaining a healthy aquatic life and aquatic food chain. Photosynthesis by autotrophic microbes within the aqua-ecology results in carbon sequestration and oxygenation of the surrounding atmosphere, also creating a blue carbon sink. Maintaining a low ambient temperature in the vicinity to nullify UHI and PVHI effects. Air pollution mitigation. Biodiversity conservation. Safeguarding the vicinity from the outbreak of water- and vector-borne diseases. Making highly potent water available for aquaculture, agriculture and animal husbandry. In this technology approach, there are five key steps in which the work is done under the Cownomics Technology for the resurrection of native ecology in Soil, Water and Air through their conjunction points, i.e., the natural land-locked Waterbodies, with a sole agenda of restoration of the ecosystem services from them to their respective vicinities.
SOP:
To make such a huge impact, the processes have to be robust and disciplined. The data collection has to be precise and scientific, so that the findings and the impact measurement could be made data-driven. That’s why there’s a clear and crisp SOP for project implementation after the award of the project –
An EIA research team (3rd party academic / research institute) does a site visit to collect the real-time data on groundwater, Soil, sludge deposits, surface Water, inlet channels, GHG emission, Air Quality and Biodiversity, to prepare a baseline survey study of pre-intervention conditions.
A video documentary team accompanies the EIA team to record their work & visit, and also interacts with the local communities to get their feedback on the daily routine problems they face due to the contaminated site. The same team shall accompany any 3rd-party academic/research institute team each time it visits the site.
Now the action begins with physical cleanup of the floating waste, installation of the gradient filters on the inlet channels, borewell installation or arranging for fresh Water, installation of the Water tanks, physical work on embankment for strengthening, plantation, etc.
The herbal medicine is shipped to the location by Vaidic Srijan LLP
The execution partner does the medicine dosing, as prescribed, and keeps maintaining the log book of dosing treatments as well as the daily records of Soil, Water and Air quality (18 parameters) through the spot testing probs provided to them in the partner’s kit.
Water Samples are lifted periodically to get tested in an NABL-accredited laboratory
After the completion of 1st two phases, another research team (3rd party academic / research institute) shall visit to conduct the Socio-Economic Impact Analysis (SEIA) survey & study.
Towards completion of the project, yet another team (3rd party academic/independent researchers / professional company/research institute) conducts the biodiversity gains assessment through GIS & Remote Sensing through satellite data.
All the collected data is compiled together, and a report is generated, which is published and submitted to the customer.
Report Overview on Soil and Air Quality throughout the project period (2024-25):
This comprehensive report analyses the environmental health of the Pavi Sadakpur Talab area over the course of a full year, in fact more than a year, from 1st July, 2024, till the end of September 2025. It is important to notice the trend in the graph below, wherein each day’s data has been plotted in a single graph.
The trend shows the yearly weather patterns too. As we all know, Delhi-NCR faces a national crisis every year from October to December and into January, because cold Air condenses in winter and PM particles are held suspended due to a lack of air movement. Moreover, the project was officially over before the commencement of the next winter due to which the data for the corresponding period is missing. But if we compare July 2025 to July 2025, we can observe a substantial decline in the PM2.5 graph given below
Key Sections Included:

Air Quality Analysis: The Air quality data through digital hand-held meter captures the data pertaining to HCHO – Formaldehyde or methanal, pungent smelling gas usually found in aqueous solutions, TVOC – Total Volatile Organic Compounds like benzene, toluene, acetone, methylene chloride etc., PM – Particulate Matter (PM 2.5, PM 1.0 and PM 10), TEMP – Temperature and HUM – Humidity in Air.
The detailed trends for PM2.5 (AQI), for Air Pollution Levels, and harmful gases indicators like HCHO and TVOC show an overall declining trend, as depicted in the above graph, based on the site log book from 1st July, 2024 till the end of September 2025. The analysis highlights critical pollution spikes during the winter months (November–January), which everyone knows about Delhi – NCR region.
Soil Health Monitoring: The analogue hand-held meter for Soil health is a device that two probes to be buried in Soil to showcase the readings pertaining to Soil Moisture, Light exposure, and Soil pH. The data shows a stable pH environment (avg. ~7.49, towards alkaline side) suitable for local flora, with moisture levels varying by season.
Summary of Performance:
Air Quality: The most volatile parameter, with AQI frequently entering "Unhealthy" zones during peak pollution months, but while the Delhi NCR AQI peaked at AQI value of above 1000, the AQI levels at pond didn’t even cross the half mark during the worst months of December and January.
Soil Stability: Generally consistent throughout the year, indicating a resilient Soil ecosystem. But the interesting trend observed that the corresponding year (in 2025) generally the Soil moisture was maintained well even during peak of summers. The pH was maintained towards alkaline side and the light exposure also stabilized.
The data reveals significant improvements across several parameters, particularly in Air Quality and Soil Stability. When comparing the beginning of the monitoring period (July 2024) to the later records (August/September 2025), the following trends emerge:
Air Quality (Most Significant Improvement)
The Air quality showed a remarkable recovery toward the end of the year-long cycle:
PM2.5 (AQI): There was a 77.7% reduction in PM2.5 levels. The average dropped from a high of 146.9 (Unhealthy) at the start to a much cleaner 32.7 (Good) by the end.
Air Pollution Level: This metric improved by 74.3%, falling from an average of 51.3 to 13.2.
TVOC (Volatile Organic Compounds): Levels decreased by 67.9%, dropping from 0.165 to 0.053, indicating a significant reduction in gaseous pollutants.
Soil Health
Soil pH (Acidity): The Soil shifted from a slightly acidic 6.2 to a more stable and fertile 7.7. This 25.3% improvement indicates the Soil moved from a potentially nutrient-locking acidic state to an optimal neutral/slightly alkaline state for local plant growth. The spike shown on 15th September, 2024 is due to the festival of Mawlid al-Nabi, during which a lot of sacrifice was done, and the waste was dumped on the embankment side of the pond.
Summary of Improvement
Note: It is important to consider that the Air Quality improvement is partly influenced by seasonality; the peak pollution levels occurred during the winter months (November-January) as shown in the Yearly Environmental Analysis Report.pdf.
Report Overview on Water Quality throughout the project period (2024-25):
During the project execution phase, as a part of Standard Operations Procedure (SOP), the execution team had three hand-held digital meters for monitoring multiple parameters of Soil, Water and Air on the spot.
The Hand-held digital spot-testing meter for Water contains multiple parameters including, Fertile, pH, H2-ppb, ORP-Mv, Resistivity, Conductivity (us/cm), TDS (-ppm), Salt %m and Salt sg.
ORP (Oxidation-Reduction Potential) measured in mV (millivolt, a unit of electrical potential equal to one-thousandth (1/1,000) of a volt (10-3)
Function: Oxidation-reduction potential is the potential (voltage) at which oxidation occurs at the anode (positive) and reduction occurs at the cathode (negative) of an electrochemical cell. In simple terms, from a microbial perspective, an oxidizing chemical pulls electrons away from the cell membrane, causing it to become destabilized and leaky. Destroying the integrity of the cell membrane leads to rapid death. Operationally much like a digital thermometer or pH probe, ORP sensors allow easy monitoring and tracking of critical disinfectant levels in Water systems.
Coupled with pH sensors, more sophisticated systems use ORP sensors to provide automated “demand-based” injection of hypochlorite (or other approved oxidising disinfectant) and acid, typically food-grade citric acid, muriatic acid, or phosphoric acid. Either Water can gain electrons or donate electrons. When the ORP value is positive, it is ready to accept electrons, but when it is negative, it is ready to donate electrons. When the water has a negative ORP value, it has free electrons to donate, which enable electron exchange that promotes the decomposition of suspended and dissolved solids, reducing viscosity, increasing transparency, and returning waves to the Waterbody.
• Ideal Value: -200 mV to -600 mV (for healthy, disinfected natural fresh water).
TDS (Total Dissolved Solids) in ppm (parts per million) or mg/L (milligrams per litre)
Function: Solids in Water can be in three forms – Suspended, dissolved, or settled. In this parameter, we are specific about Dissolved solids. It is often taken as TDS refers to invisible, dissolved inorganic salts and organic matter (< 2 \µm) that pass through a filter, while TSS measures visible particles (>2 \µm) trapped by a filter, affecting Water clarity (or turbidity). High TSS makes Water turbid (cloudy) or muddy, whereas high TDS generally does not affect Water clarity but does affect taste and mineral content.
TDS measures the total concentration of dissolved inorganic salts (calcium, magnesium, potassium, sodium, bicarbonates, chlorides, and sulphates) and small amounts of organic matter. While a high TSS reduces light penetration in water, negatively impacting photosynthesis and reducing the production of oxygen in water, which harms aquatic life. On the other hand, high TDS levels indicate nutrient overload, which invites aquatic weed growth, eventually covering the entire surface of the Waterbody and, in turn, reducing light penetration and compromising oxygen production.
Ideal Value: 50 to 500 ppm.
Impact of Deviation:
High TDS (> 1,000 ppm): a high TDS translates in high concentration of various salts resulting into Water becoming "hard". This essentially means, the taste will become salty and phosphates (detergents) wouldn’t develop any froth.
Extremely Low TDS: Low TDS will make Water taste "flat". This type of Water can actually be corrosive because lacks mineral ions, which also translates into reduced conductivity. This is also called “demineralized” Water, usually what we get as an output of the RO (Reverse Osmosis) filters, commonly found in homes these days. This low TDS Water is bad for human / terrestrial animal health too. However, the RO Reject Water is usually very high TDS (upwards of 1000 ppm).
Conductivity (µs/cm) and Resistivity
Function: Conductivity, as the name suggests, makes Water work as a conductor of electrical charge, while on the other hand, resistivity is the ability of water to resist electrical charge. By default, both are inversely proportional to each other. A higher conductivity means lower resistivity, and vice versa. Better conductivity also means a better electrolyte balance in Water.
Ideal Value: 50 to 800 µs/cm (Conductivity).
H2-ppb (Dissolved Hydrogen)
Function: The concentration of molecular hydrogen in Water directly affects its potential benefits. Higher H₂ levels typically mean a stronger antioxidant effect, greater cellular protection, and more noticeable improvements in energy, inflammation, and recovery.
Clinical research suggests that the therapeutic range for hydrogen Water begins at 0.5 PPM, with benefits observed up to 4.0 PPM or more, depending on the delivery method. In contrast, PPB levels may be too low to produce meaningful physiological effects.
So, if your hydrogen Water only contains 200–500 PPB, you're receiving a significantly lower concentration than a 2.0–3.0 PPM bottle, and you may not experience the same results.
Salinity: Salt % and Salt SG (Specific Gravity)
Function: Salinity is a true measurement of the concentration of salt in Water and is calculated as the total weight of ‘dry’ salt dissolved in a total of 1000 weight units of Water or parts per thousand (ppt). The generally accepted standard salinity for natural seawater (NSW) is 35ppt. Specific Gravity is expressed as the ratio of the density of Water relative to the density of the same volume of pure Water. As the density of a liquid is calculated as the weight of a unit volume of that liquid and because liquids expand with temperature, then the volume that we measure and subsequently the weight of that volume will also change. S.G. is therefore measured at a specific temperature, e.g. 1.025 at 25⁰C.
Salt % measures the mass of salts relative to the Water. Salt SG measures the density of the Water compared to pure Water (1.000).
Ideal Value: < 0.1% and ~1.000 SG for fresh water.
Impact of Deviation:
Increased Salinity: It is natural that terrestrial animals and plants can’t consume salts beyond a particular limit, while marine life forms are absolutely fine with brackishness or salinity. For terrestrial life forms, even a small rise can be fatal, especially to freshwater fishes and plants (plasmolysis). It also makes the Water unsuitable for traditional irrigation, as it causes "Soil thirst" and stunts crop growth. Thus, if the salinity is high, Water becomes unfit for human use, as it can neither be used for agriculture, aquaculture, or animal husbandry nor for drinking.
"Fertile" (Nutrient Level)
Function: Often used in ecological monitoring to describe the nutrient richness (Nitrates and Phosphates).
Ideal Value: Moderate. (Too low = "Dead" Water; Too high = Eutrophication).
Impact of Deviation:
Out of Limit (High): Leads to algal blooms, which consume all available oxygen, resulting in massive fish kills—a process called eutrophication.
Summary Table for Fresh Water
Results:
pH Stability: While the Water became more alkaline (shifting from 7.7 to 9.0), it moved away from the extreme, erratic spikes (some reaching over 800 in the raw logs) seen in the middle of the monitoring period, suggesting a more settled aquatic environment.
Water Quality Trend
The year-long Water quality analysis from the Daily Log Book of Pavi Sadakpur Talab (Nagar Palika Parishad Loni) reveals distinct seasonal patterns and measurable improvements in several key metrics. As the project is essentially Waterbody Rejuvenation, the quality of water, aquatic biodiversity, and the aquatic food chain will naturally take centre stage. The water parameters are tested right from the initial baseline survey of EIA by the research team, followed by the daily log book entry based on the findings of digital hand-held meter’s spot testing, then the Water samples are periodically lifted and sent to NABL accredited laboratory, and finally we also try to get that capture in the GIS, remote sensing and Satellite data study towards the end of the project
The graphs shown below are based primarily on daily logbook input data.
The report will refer to the NABL lab reports as well as the reports from IIT – Delhi in a separate section. However, since that would be a much smaller dataset, the graph would be easier to create and elaborate on; therefore, it is kept in a different section of the report. Moreover, in the laboratory, we can test a much larger number of parameters across physical, chemical, and biological subsets.
Seasonal Impact & Deviations Analysis
Seasonal changes affect the Water in an open public pond; therefore, the Pavi Sadakpur pond would naturally be no different. The summer's record-high temperatures warm the top layer of water, making it vulnerable to algal blooms, which are followed by the rainy season or the monsoon, causing heavy downpours of fresh water.
During the monsoon, apart from fresh Water being added through natural rainfall, the inlet drains are also flushed due to the high volume and velocity of Water flow, carrying a lot of settled solids (sludge) into the Waterbody. Even stormwater and runoff can add many contaminants to the water, and the Waterbody must have the capacity to handle them to remain healthy.
Then comes the winter season, during which the angle of sunlight changes, creating a unique, low-angle, and transient Natural Environment that has profound impacts on human health, mental well-being, environmental energy levels, and water. This will naturally make TDS go up, ORP go negative, pH move to the alkaline side, conductivity go up, resistivity go down, and turbidity go up.
All these factors lead to high-viscosity, still water, which naturally becomes the best breeding ground for mosquitoes and emits a foul smell in the vicinity. That is why post-monsoon vector-borne disease cases go high. But Pavi Sadakpur Talab under rejuvenation through NbS remained resilient to all these problems.
Overall Year-Long Improvement Summary
The most critical "norm" was the high summer salinity, which the pond successfully recovered from during the monsoon and winter cycles. The most significant technical improvement was the stabilisation of TDS and a 97.4% reduction in Salt% (97.4%), moving the Water from a "brackish" profile toward a more "freshwater" ecosystem profile. This naturally impacted the groundwater table as well, a phenomenon that the technology inventors (M/s. Vaidic Srijan) called as Ground Water Correction (GWC). Recharge is widely understood worldwide, but "correction" is a new term.
All healthy Waterbodies not only ensure the recharge of groundwater but also contribute to the qualitative improvement of groundwater, which they call GWC. This is the process of in situ desalination of groundwater. The locals confirmed during the making of the video documentary that the saline Water from their borewells has started becoming sweeter, and their cattle have started drinking the Water they used to reject earlier.
The Sadakpur Talab Water Quality Annual Performance Report has been successfully generated based on year-long monitoring data (the site logbook) and the socio-economic impact study conducted by the Giri Institute of Development Studies, Lucknow. The graphical comparative charts have been shown in Figures 3 & 4 above; here, we are just summarising the report.
Key Report Features:
Comprehensive Trends: Graphical representations for all nine Water parameters, including TDS, pH, ORP, and Conductivity.
Seasonal Analysis: Detailed explanation of how Summer (evaporation/concentration), Monsoon (dilution/recharge), and Winter (solubility/stabilization) impacted the Water's chemistry.
Measured Improvements: A comparison of initial and final readings showing stabilisation trends, such as a 5.70% reduction in TDS and a significant reduction in erratic salinity levels.
Deviation Records: Identification of anomalies, such as summer peaks in alkalinity and monsoon runoff impacts.
TDS & Conductivity: Shows the "flushing" effect of the monsoon rains, which effectively lowered the concentration of dissolved solids.
Oxidation-Reduction Potential (ORP): Illustrates the Water's shifting ability to break down organic waste, peaking in winter due to higher dissolved oxygen.
Salinity (Salt%): Displays a dramatic improvement, moving from high initial brackishness to a more stable freshwater profile.
The UHI Impact
Based on the Giri Institute's Socio-Economic Impact Assessment and supporting data ( the site Log book) on the 365 days monitoring of the 18 parameters of Soil, Water and Air, regarding the intervention done through NbS approach of Cownomics Technology used at the site, we can definitively confirm the trend of the ambient temperature: The local ambient temperature and the Urban Heat Island (UHI) effect have gone down, observably by almost 4.5 ⁰C.
Basically, water bodies act as heat sinks due to Water's exceptionally high specific heat capacity, allowing it to absorb, store, and transport large amounts of solar heat with minimal temperature change. Through evaporation, they also provide localised cooling, mitigating high temperatures in surrounding environments. And the same is depicted in the graphs below, which are based on the 365-day capture of local temperature monitoring via the site logbook.
How the Rejuvenation Lowered the Ambient Temperature:
All Waterbodies are natural heat sinks and therefore our biggest tool to combat Global Warming, provided they are kept in good health. Oceans regulate the planet's temperature through warm and cold ocean currents, a fact known to all students of Science, especially Geography. All this happens due to the basic properties of Water.
Even in the industries, water is used in the cooling tower to reduce the temperature, or for that matter, in the automobiles as well, the radiators in the vehicles. Water is used as a coolant. The same is applicable to water bodies in open public spaces. They bring down the ambient temperature. The following are some of the key factors due to which Waterbodies help in lowering the temperature.
High Heat Capacity: Water requires much more energy to raise its temperature compared to land or air, allowing it to store vast amounts of heat.
Evaporative Cooling: As Sunlight hits the water, carrying infrared radiation, it drives evaporation, removing latent heat and reducing the surface and surrounding air temperatures due to the added water vapour in the atmosphere. This also maintains relative humidity in the air and eventually leads to better rainfall during the monsoon season.
Thermal Regulation/Thermal Inertia: Water bodies act as a "thermostat" because they heat up slowly in the summer and cool down slowly in the winter, stabilising local climates and ambient temperature. This is why we find river and pond water to be hot in winter and cold in summer.
According to the report, restoring the Waterbody to "good health" reinstated its natural "Ecosystem Services," which directly impacts the local microclimate.
1. Nullifying UHI and PVHI: A healthy, functioning Waterbody acts as a natural heat sink, bringing down the ambient temperature by almost 6-8⁰C, as reported in various research papers across the globe.
2. Evaporative Cooling: Prior to the project, the pond was choked with sludge and waste, blocking natural Water-Air interactions. By healing the pond and re-establishing the aquatic food chain, natural evaporation resumed. As Water evaporates, it absorbs latent heat from the surrounding air, cooling the immediate vicinity of Pavi Sadakpur Village.
3. Increased Greenery: The project often involves surrounding plantation efforts. The data shows a massive improvement in the perception of surrounding greenery, which provides shade and further evaporative cooling via plant transpiration, directly combating the localised heat island effect.
Rainfall Trend Analysis (2023–2025)
Based on regional monitoring by the India Meteorological Department (IMD) and seasonal climate reports, Pavi Sadakpur Village has experienced a significant upward trend in annual rainfall between 2023 (pre-intervention), 2024 (during-intervention) and 2025 (post-intervention). This is natural. Water bodies attract more rain because they increase atmospheric moisture, while absorbing the heat-carrying infrared rays from the Sunlight. Water is heated, causing evaporation.
When Water evaporates, it directly supports cloud formation and precipitation. Remember the water cycle? Now, large water bodies like oceans and lakes create higher local humidity, leading to increased rainfall, particularly in coastal areas compared to dry inland regions, as part of the continuous water cycle. But what happens at the macro level in large water bodies will surely happen at the micro level in small water bodies. But the impact will surely be felt with increased downpour, and that’s what the trends show as well.
2023 (Normal Year): It is important to note that in 2023, there was no intervention. The project started in 2024; therefore, data have been collected to establish a pre-intervention baseline. And as expected, the monsoon arrived in the Ghaziabad region on June 25th, according to publicly available historical records. The year concluded with a "Normal" rainfall status, totalling approximately 750 mm, which is consistent with the long-period average for the district.
2024 (Above Normal Year): The project has started before the monsoon season, and we’ve seen the health of the Waterbody has improved during the monsoon to such an extent that once a neglected nuisance for the village has been transformed into an asset. This year in the monsoon, people started bathing in the Waterbody. With this improved health of the Waterbody, rainfall also increased by approximately 11% compared to the norm. The annual total for the village is estimated at 825 mm.
2025 (Excess Year): Although the project started in the year 2024, it was on till the monsoon of the year 2025; it finally ended in September, 2025. As the Waterbody was even healthier, we saw an even better monsoon. This year witnessed extraordinary precipitation levels. Regional data for Northwest India indicate that 2025 was the year with the highest rainfall since 2001. The annual rainfall data available in the public domain confirm that the cumulative totals reach up to 1050 mm, placing the year in the "Excess" category for rainfall.
Comparative Rainfall Statistics
Conclusion:
The annual rainfall in Pavi Sadakpur Village has increased dramatically compared to the last three years: 2023 (pre-intervention), 2024 (during-intervention), and 2025 (post-intervention). Now, there could be many factors impacting the rain, from western disturbances to Mediterranean Cyclones to seasonal monsoon winds (popularly known as Purwai) to El Niño/La Niña and many more, but the fact of the matter is that it coincides dramatically with the rejuvenation project for the Waterbody.
Maybe following the trend over the next couple of years could give us a better picture, but at present we can’t rule out the contribution of the Waterbody, especially when we consider the larger picture of UHI impact, Air Quality impact, biodiversity trends, and various other environmental factors improving drastically. There can’t be so many coincidences. Thus, we can conclude that there’s a critical role of rejuvenated local Waterbodies, such as the Pavi Sadakpur Pond, in acting as vital flood-mitigation buffers and aquifer recharge zones during high-intensity rainfall events.
About the Author
Madhukar Swayambhu is a corporate leader, entrepreneur, startup mentor, TEDx speaker, and Water Hero Award recipient by the Jal Shakti Ministry, Government of India. With over 30 years of experience, he serves on several national and international committees, including BIS, IWA, and Blue Community South Asia. Recognized globally for his contributions to water, sustainability, and environmental restoration, he has represented India at major international forums, including G20, COP28, COP29, COP30, and leading global conferences across Asia, Europe, Africa, and the Americas.